FY Mar-2023 Financial Highlights
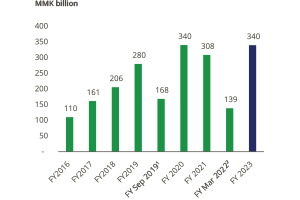
MMK 339.6 Bn
12-month Revenue
12-month revenue was mainly driven
by income growth in Financial and
Healthcare Segments.
MMK 15.2 Bn
Total Comprehensive Income
Mainly due to the increased in
overall revenue and translation gains
while controlling the operating costs.
MMK 4.1 Bn
Net Profit for the Year
Driven by financial services revenue across all income
segments when a result of the substantial cost
controls imposed by the Group.
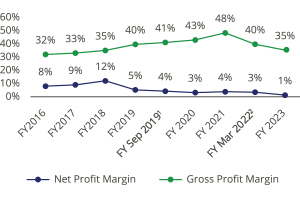
35.3 %
Gross Profit Margin
Drop in GP margin mainly due to higher direct costs
from Healthcare Services when Financial Services
manage higher cost of fund.
Financial Performance Summary
| FY 2023* Audited | FY 2022** Unaudited | % Change | |
|---|---|---|---|
| Statement of Income (MMK ’000) | |||
| Revenue | 339,593,407 | 283,093,569 | 20.0% |
| Gross Profit | 119,734,442 | 126,396,183 | (5.3%) |
| Net Profit | 4,133,004 | 236,503 | 1647.5% |
| Total Comprehensive Income | 15,208,546 | (7,645,885) | 298.9% |
| Net Profit attributable to Equity Holders | (701,769) | 2,169,433 | (132.3%) |
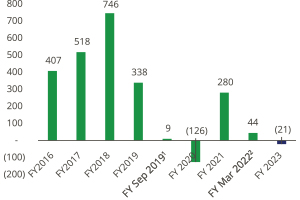
| Basic (loss)/earnings per share (MMK) | (21) | 66 | (131.8%) |
| Statement of Financial Position (MMK ’000) | As at 31-Mar-2023 | As at 31-Mar-2022 | % Change |
| Total Assets | 4,186,260,866 | 3,419,973,957 | 22.4% |
| Total Liabilities | 3,674,322,104 | 2,915,850,077 | (26.0%) |
| Total Equity | 511,938,762 | 504,123,880 | 1.6% |
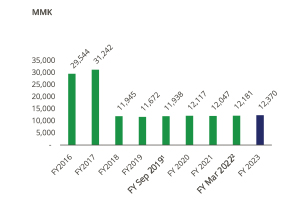
| Net Asset value per share (MMK) | 12,370*** | 12,181*** | 1.6% |
| Financial Indicators | |||
| Gross Profit Margin (%) | 35.3% | 44.6% | (20.9%) |
| Net Profit Margin (%) | 1.2% | 0.1% | 1100.0% |
| Net Gearing (%) | 24.1% | 19.4% | 24.2% |
* Audited financial report covering the financial year FY 2023 (1 Apr’22 to 31 Mar’23).
** Unaudited financial report covering 12-month combined period from 1 Apr’21 to 31 Mar’22.
*** Net Asset Value Per Share is calculated by dividing the total net asset value of the Company by the number of outstanding shares (inclusive of convertible shares under Restructured Loan Agreement)
Revenue
Sources of Income
Gross Profit and Net Profit Margin
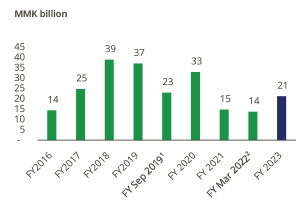
Core Operating EBITDA
Earnings Per Share
Net Asset Value Per Share
1 FY Sep 2019 is the reporting period of six months between 1 April 2019 and 30 September 2019.
2 FY Mar 2022 is the reporting period of six months between 1 October 2021 and 31 March 2022.
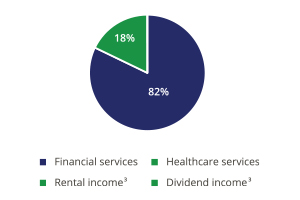
3 Dividend Income and Rental Income collectively made up less than 1% of total sources of income.
FMI Group Overview
As the economy turned positive in its growth when compared against the previous comparative period of combined 12 months (1 Apr 21 to 30 Sep 21 and 1 Oct 21 to 31 Mar 22, (“FY 2022”)), the Group’s businesses have been moving towards capturing business opportunities while keeping continuous operational enhancement. The Group’s revenue increased by 20% to MMK 339.6 Bn in FY 2023, in which 82% of total revenue MMK 279.0 Bn is contributed by the financial services segment as all sources of its income streams performed better than FY 2022. The healthcare segment also contributed 18% of total revenue sum up to MMK 60.5 Bn, primarily from core organic hospital operations made up of clinical function and ancillary services. At the same time, Pun Hlaing Hospitals are expanding their activities on developing additional emerging healthcare units, emerging HEAL Laboratory and a new digital platform “HEAL App”.
The Group’s gross profit reduced by 5.3% despite improvements in overall revenue which was driven by the higher costs of funds in connection with the growth in customer deposit balance from Yoma Bank together with the increase in direct costs from Pun Hlaing Hospitals.
Given the fact that all segments had to endure inflated prices, the Group’s operating expenses increased this year reflecting the cost-of-living allowances and general commodity prices increase. However, positive recognition of NPL provisions through excellent loan recovery from Yoma Bank resulted in a 20% reduction of the Group’s total operating expenses against the previous comparative FY 2022.
Even though a lower share of profit from associates and joint venture was obtained, the Group’s net profit significantly outperformed during FY 2023 and attained MMK 4.1 Bn compared against FY 2022 reported profit of MMK 0.2 Bn for the aforementioned reasons.
The Group’s total assets increased by 22.4% to MMK 4.2 Tn primarily as a result of the increased investment in the Bank’s loans, treasury portfolios and the acquisition of head office property at StarCity. Total liabilities of the Group increased by 26.0% resulting from the larger customer deposit balance enforced by the Bank’s Flexi products.
The Group’s equity also increased by 1.6%, primarily attributable to the increase in equity reserve and decrease in non-controlling interest for Yoma Bank.


